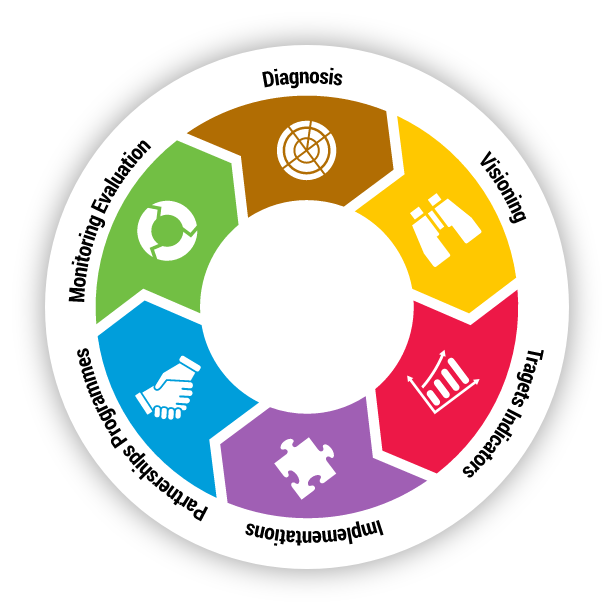
Step 6: Monitoring and evaluation
Data and indicators help authorities make good policy choices and monitor those choices.
The final step in the development of a sustainable freight transport strategy is to monitor and evaluate performance and progress. This would entail collecting, monitoring and analysing data during strategy implementation to evaluate progress and impact. A monitoring and evaluation data system should be:
Monitoring and evaluation
The final step in the development of a sustainable freight transport strategy is to monitor and evaluate performance and progress. This would entail collecting, monitoring and analysing data during strategy implementation to evaluate progress and impact. A monitoring and evaluation data system should be:
When considering the indicators required for monitoring and assessing progress towards the desired goals, a balance between convenience and comprehensiveness needs to be achieved. A smaller set of indicators, using easily available data, is more convenient to collect and analyse but may overlook important sustainability-related impacts. A larger set of indicators may provide a comprehensive assessment, but data collection and processing could be extremely expensive which may undermine the monitoring process.
As noted under step 3 on Targets and Indicators, it is extremely important to define, early in the planning process, the indicators required for monitoring and to involve multiple stakeholders for effective and efficient data collection and double counting avoidance. If indicators are not selected carefully, they can consume extensive resources and undermine the usefulness and value of the data generated. International and development organisations can play an important role in strengthening the capacity to collect, analyse, and manage data and indicators.
Specific methodologies and processes need to be established to quantify each of the KPIs and indicators identified for monitoring. Examples of indicators used for Monitoring, Reporting, Verification (MRV) various Sustainable Freight Transport Strategies are compiled in the table below.
Following the quantification of indicators, a comparison is made between the estimated values and specific pre-established thresholds. If the value of the indicators quantified during the monitoring process is lower than the establishged threshold (or does not reach its anticipated level), then the action has failed to meet its set objective. Alternatively, the measures are believed to be consistent with the objective, if the value of the quantified indicators, meets the threshold. By routinely assessing the performance of the freight transport sector in terms of its ability to balance the various objectives under the three dimensions of sustainability i.e. economic, social, and environmental, gaps and needs can be assessed in a systematic and consistent manner and corrections/adjustments can be introduced in a timely manner.
Examples of indicators selected for monitoring and evaluating sustainable freight transport strategies
| Name | Market | Vision/Goal | Objectives/ Targets | Monitor, Report, Verify (MRV) Indicators |
|---|---|---|---|---|
| California Sustainable Freight Action Plan | State | Utilise a partnership of federal, State, regional, local, community, and industry stakeholders to move freight in California on a modern, safe, integrated, and resilient system that continues to support California’s economy, jobs, and healthy, liveable communities. Transporting freight reliably and efficiently by zero-emission equipment everywhere feasible, and near-zero emission equipment powered by clean, low- carbon renewable fuels everywhere else. |
|
|
| National | A freight and logistics sector that is cost-efficient, reliable, resilient, environmentally sustainable and valued by society. |
|
This list is non-exhaustive. | |
Canada has developed a national green shipping corridors framework to guide the people and organizations who are developing the green shipping corridors. To make sure that green shipping corridors are implemented consistently, our framework allows and empowers all parties to work together to eliminate greenhouse gas emissions and tackle the climate crisis. This framework will showcase Canada's leadership in reducing the environmental impacts of our marine transportation sector, and help Canada stay competitive. Being at the forefront of reducing marine emissions will create new opportunities for Canadian clean tech and clean fuel innovators, and contribute to Canada's economic growth and prosperity. | As part of this plan, we committed to:
| Involves, but is not limited to:
| ||
| Smartway Initiative | Shippers, carriers, freight transport/logistics service providers | Help companies advance supply chain sustainability by measuring, benchmarking, and fostering freight transportation efficiency. |
|
|
| Transport, logistics and energy provider | A.P. Moller - Maersk enables its customers to trade and grow by transporting goods anywhere. Our business model supports our vision of providing truly integrated logistics that create value for our customers. By combining a leadership position in Oceans with Logistics & Services and Terminals, and by realising synergies across our business, we create better outcomes for our customers. |
|
This list is non-exhaustive. |